

The Australian graduate job market is undergoing a seismic shift. Gone are the days when a clean resume and a basic understanding of Microsoft Excel were enough to secure a entry-level corporate role in Sydney, Melbourne, or Brisbane. Today, Australia’s digital economy is expanding exponentially, driven by massive investments in automation, cloud computing, and business intelligence (BI).
According to data from the Australian Bureau of Statistics (ABS), over 85% of Australian businesses now report using digital technologies to drive operational decisions. At the heart of this data revolution sits one specific software ecosystem: Tableau.
From the banking giants of Martin Place to the logistics and supply chain conglomerates in Western Australia, employers are no longer treating data visualization as a niche skill reserved for specialized data scientists. Instead, it has become a core competency across marketing, finance, human resources, and healthcare administration. For university students preparing to enter this hyper-competitive landscape, proficiency in data storytelling via Tableau is rapidly transitioning from an impressive resume line-item to an absolute, non-negotiable prerequisite.
The Shift from Spreadsheets to Interactive Storytelling
For decades, higher education institutions relied heavily on spreadsheets to teach data analysis. While tools like Excel remain fundamental for data entry and linear calculations, they fail significantly when tasked with processing modern, enterprise-level big data. Australian enterprises deal with multi-layered data streams—ranging from real-time customer sentiment analysis to predictive supply chain models.
Tableau bridges the gap between raw data and actionable corporate strategy. It allows users to ingest millions of rows of data from disparate sources (like SQL databases, cloud storage, and Google Analytics) and transform them into interactive, real-time dashboards.
Why Australian Corporate Hubs Prefer Tableau
- Speed to Insight: Australian corporate teams use Tableau to spot market anomalies and consumer trends in minutes rather than spending days compiling static PDF reports.
- Executive-Ready Delivery: C-suite executives in Australia’s ASX 200 companies demand dynamic visual narratives over dense text documents.
- Democratisation of Data: Tableau allows non-technical stakeholders to interact with data filters, drilling down into state-by-state metrics (e.g., NSW vs. VIC performance) without needing to write complex code.
This structural shift in the business environment has placed immense pressure on university commerce, engineering, and IT faculties across Australia. Academic curricula have rapidly evolved, integrating sophisticated data visualization modules into core units.
The Academic Learning Curve and the Student Reality
While the demand for data literacy is clear, the academic reality for many international and domestic students in Australia is incredibly challenging. Mastering dashboard design, dashboard actions, calculated fields, and data blending requires a steep learning curve that combines technical database logic with creative visual design principles.
University assessments are no longer just about calculating the correct mathematical answer; professors now evaluate how effectively a student can visually communicate that answer to a simulated board of directors. Confronted with strict marking rubrics that penalise poor design choices or faulty data connections, an increasing number of university students are seeking structured support.
To cope with these rigorous requirements and protect their GPAs, many students leverage comprehensive, tailored tableau assignment help to deeply understand software mechanics, successfully debug complex data visualizations, and meet demanding university deadlines. This specialized guidance helps bridge the gap between classroom theory and the practical application required for high-distinction grades.
The Skill-to-Salary Bridge: Analyzing Australian Market Data
The financial incentive for mastering Tableau before entering the Australian workforce is substantial. Data compiled from major Australian employment platforms like Seek, Indeed, and Talent.com highlights a direct, undeniable correlation between data visualization proficiency and entry-level remuneration packages.
| Job Sector / Role in Australia | Average Entry-Level Salary (AUD) | Premium with Tableau/BI Skills | Target Cities |
| Graduate Graduate Business Analyst | $75,000 – $85,000 | + 12% to 15% | Sydney, Melbourne |
| Graduate Marketing Coordinator | $65,000 – $72,000 | + 8% to 10% | Brisbane, Sydney |
| Graduate Financial Analyst | $80,000 – $90,000 | + 10% to 14% | Melbourne, Perth |
| Supply Chain & Logistics Graduate | $70,000 – $78,000 | + 9% to 11% | Melbourne, Adelaide |
The “Skill-to-Salary” Infographic
Below is the structured layout representing the financial trajectory for Australian graduates who possess advanced business intelligence and Tableau capabilities versus those with traditional spreadsheet skills.
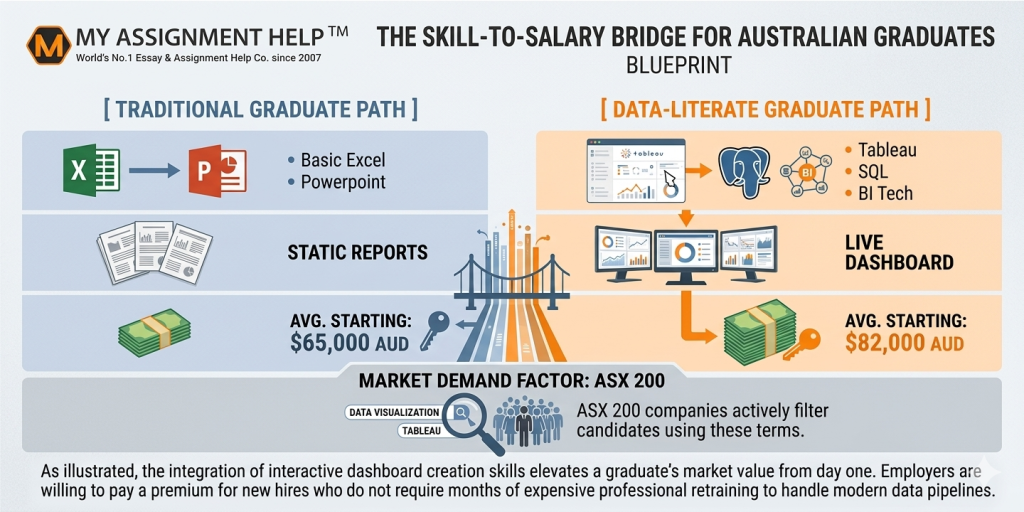
As illustrated, the integration of interactive dashboard creation skills elevates a graduate’s market value from day one. Employers are willing to pay a premium for new hires who do not require months of expensive professional retraining to handle modern data pipelines.
Industry Deep Dive: How Different Sectors Use Tableau in Australia
To appreciate why this software has become completely non-negotiable, one must examine how distinct sectors within the Australian business landscape deploy it daily to solve real-world logistical and financial problems.
1. Banking, Financial Services, and Insurance (BFSI)
In financial capitals like Sydney’s CBD, institutions like Commonwealth Bank (CBA), Westpac, and Macquarie Group process billions of transactions daily. Graduates entering these organizations use Tableau to monitor risk exposure, visualize credit risk portfolios, and spot anomalous fraudulent patterns through geographic heatmaps.
2. Retail and E-Commerce
With the rapid growth of digital storefronts and major domestic retailers like Wesfarmers (Kmart, Target, Bunnings) and Woolworths Group dominating the consumer landscape, inventory management is highly data-reliant. Tableau dashboards are used to track real-time supply chain velocity, regional stock deficits, and customer purchasing behaviors across various states.
3. Healthcare and Public Policy
The pandemic permanently accelerated the healthcare sector’s reliance on clear data reporting. Government agencies across New South Wales (NSW Health) and Victoria (DHHS) heavily rely on Tableau public dashboards to track healthcare resource allocations, hospital bed occupancies, and epidemiological trends across regional and metro areas.
Navigating Academic Rigour to Reach Career Readiness
The path to career readiness requires more than just skimming software tutorials. University professors expect students to build fully functioning data schemas, execute precise joins, and design clean UX/UI layouts within their interactive workbooks.
When managing heavy course loads across multiple units, academic writing support from trusted platforms can make a defining difference. For students aiming to optimize their entire course load across all disciplines, relying on the academic experts at myassignmenthelp australia provides an invaluable competitive edge. Balancing high-level data analysis assignments alongside general management, law, or economics essays requires a holistic approach to academic excellence—ensuring every submission meets rigorous Australian academic guidelines.
By mastering these tools early, graduates enter the market not as passive observers of data, but as active strategic assets capable of influencing corporate trajectories.
Key Takeaways
- Excel is No Longer Enough: While spreadsheet literacy remains foundational, Australian enterprises require advanced capabilities in interactive data visualization tools like Tableau.
- Substantial Salary Premium: Graduates entering the job market with demonstrated Tableau skills command salaries up to 15% higher than their peers in equivalent entry-level corporate roles.
- Widespread Industry Adoption: Tableau is heavily integrated into the operations of ASX 200 firms spanning financial services, retail, supply chain logistics, and healthcare administration.
- Academic Standards are Higher: Australian universities have heightened rubric expectations, demanding professional data design and clean visualization architectures in standard student projects.
Frequently Asked Questions (FAQ)
Why are Australian employers prioritizing Tableau over traditional reporting tools?
Traditional reporting tools generate static, historical snapshots of data. Tableau allows corporate teams to connect directly to live data pipelines, enabling interactive filtering and real-time insights that help executives make immediate, data-backed strategic moves.
Do I need a strong coding background to learn Tableau effectively?
No. Tableau features an intuitive drag-and-drop interface. However, mastering it requires a solid understanding of fundamental data structures, database relationships (such as joins and blends), and calculation formulas.
Which university degrees in Australia benefit the most from Tableau skills?
While commerce, business analytics, finance, and information technology degrees see the most direct application, fields like digital marketing, logistics, health administration, and civil engineering increasingly require Tableau competency.
What is the best way to demonstrate my Tableau skills to Australian recruiters?
The most effective approach is to construct a public digital portfolio on Tableau Public and link it directly to your LinkedIn profile and resume. This provides prospective employers with tangible, visual proof of your capability to clean, model, and present complex data sets.
References and Authoritative Sources
- Australian Bureau of Statistics (ABS): Digital Technology Adoption in Australian Business Operations (2025/2026 Reports).
- Seek.com.au & Talent.com: Employment Market Insights and Salary Aggregates for Graduate Business and Data Analysts (Australia, Q1 2026).
- Tech Council of Australia: Australia’s Digital Workforce Growth and Tech Skill Demand Forecast towards 2030.
Author Biography
Sarah Jenkins, Senior Academic Strategist & Data Analytics Consultant
Sarah Jenkins holds a Master of Data Science from the University of Melbourne and boasts over nine years of experience building enterprise-level business intelligence solutions for Australian financial firms. Currently working as a senior content strategist and student advisor at MyAssignmentHelp, Sarah bridges the gap between complex industry practices and higher education requirements. She specializes in guiding Australian undergraduate and postgraduate students through the technical intricacies of data modeling, dashboard deployment, and visual narrative design.